Which Ryzen processor should you choose for content creation in 2025? 9700X, 9800X3D, 9950X or 9950X3D put to the test.
Xavier Lamy / 05.23.2025 / 3D artist AMD Benchmark Processor
AN UPGRADE WORTH THE COST?
Many creatives and developers wonder whether moving up to a 9950X or 9950X3D is worth it for their workstation. Rather than relying solely on gaming performance, we at OSHKO decided to evaluate these CPUs in real‑world productivity scenarios: 3D rendering, file compression, photo editing and video editing.
This article therefore highlights the comparative performance of the Ryzen 9700X, 9800X3D, 9950X and 9950X3D, all paired with an ASUS RTX 5090 32 GB graphics card. The goal? To help you choose the best processor for your professional needs.
THE TESTS
To gauge real‑world productivity performance, we used the following benchmarks:
- Cinebench R23 Single core
- Cinebench R23 Multi core
- 3DMark (Speed Way, Time Spy, Port Royal)
- 7 Zip Compression
- 7 Zip Decompression
THE BUILDS & SETTINGS
The test rigs were OSHKO Creator Pro systems equipped with:
- ASUS GeForce RTX 5090 32GB
- 128GB DDR5 5600 MHz RAM
- 2TB PCIe 990 PRO M.2 SSD
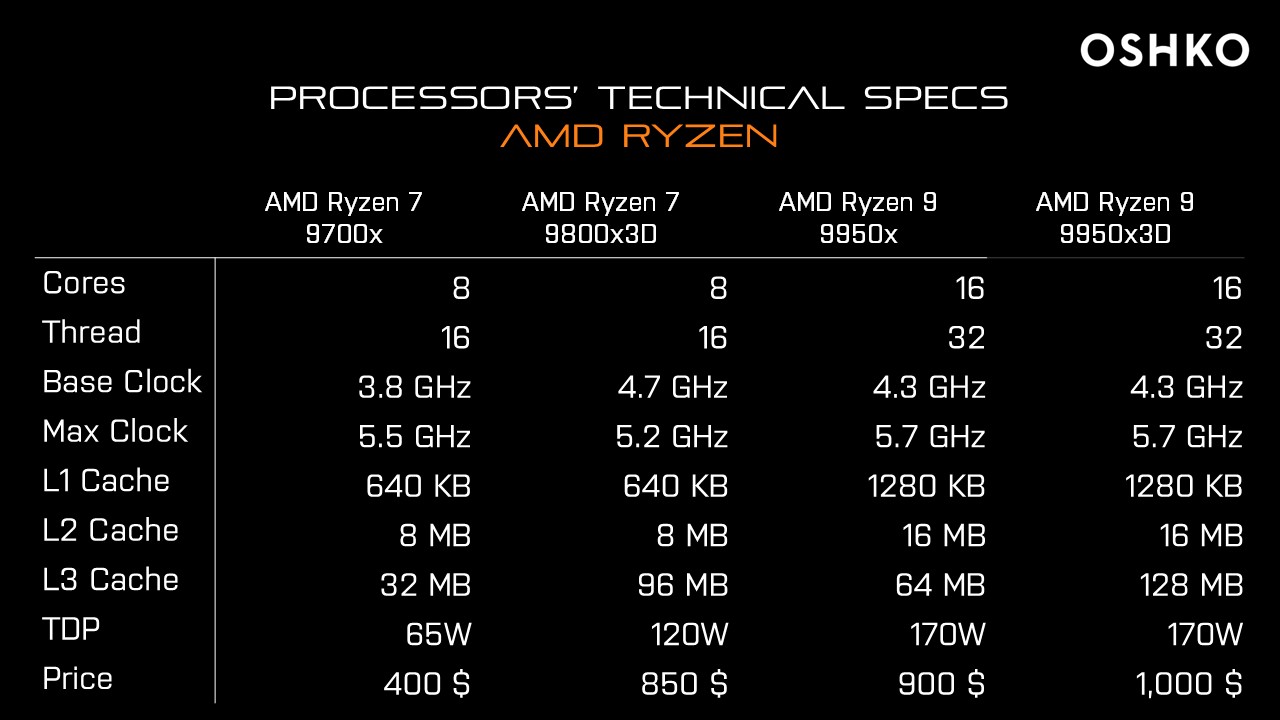
THE PROCESSORS – TECHNICAL SPECIFICATIONS
The four CPUs share a modern architecture but differ in configuration:
- Ryzen 7 9700X and 9800X3D feature 8 cores / 16 threads, while Ryzen 9 9950X3D and 9950X double that with 16 cores / 32 threads.
- Boost clocks: 9700X up to 5.5 GHz, 9800X3D 5.2 GHz, and the Ryzen 9s reach 5.7 GHz.
- “3D” variants (9800X3D and 9950X3D) stand out with massive L3 cache, 96 MB and 128 MB respectively, versus 32 MB on the 9700X and 64 MB on the 5950X.
- Power draw: Ryzen 9s show a 170 W TDP, versus 120 W for the 9800X3D and just 65 W for the 9700X, underscoring the entry‑level model’s efficiency.
- Pricing: 9700X is most affordable at $400, followed by the 9800X3D at $850, the 9950X at $900 and the more high‑end 9950X3D at $1,000.
Click on the table to enlarge the image.
TESTS RESULTS
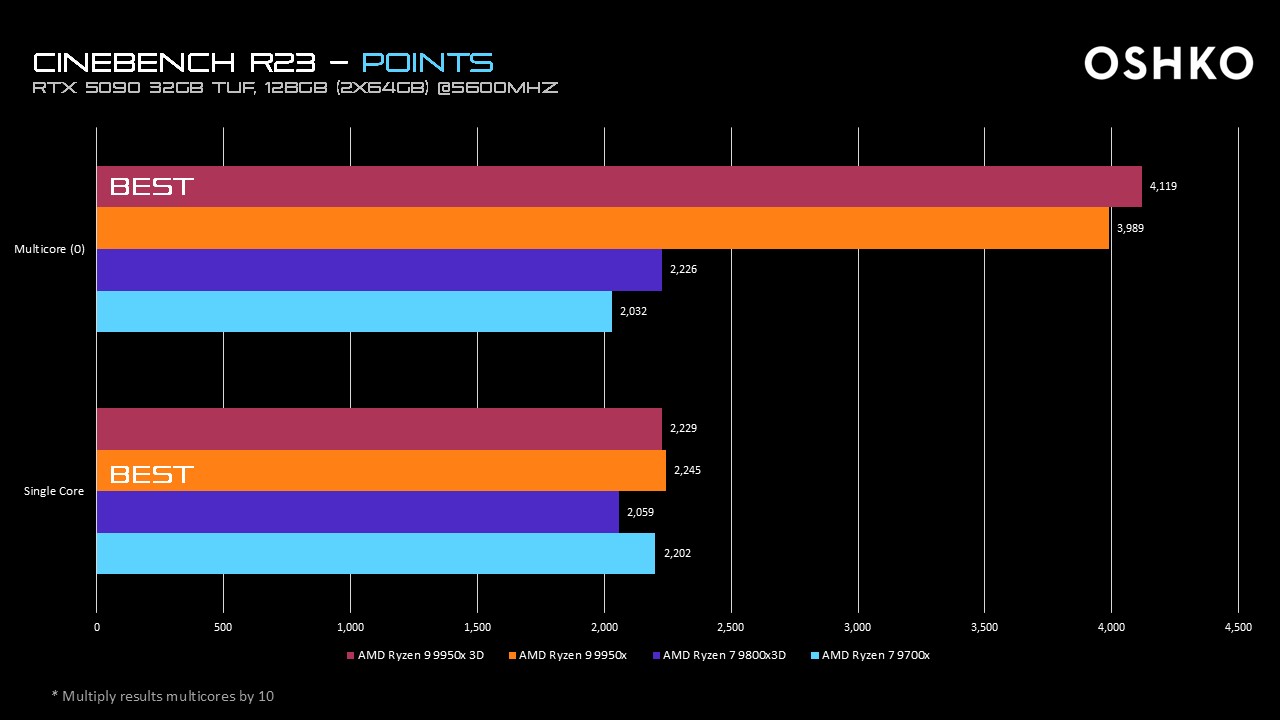
CINEBENCH R23 – SCORES: 9950X3D LEADS IN MULTI CORE
Multi‑core: 9950X3D tops the chart with 41,190 pts, +3.3 % over 9950X (39,890 pts), +85.0 % over 9800X3D (22,260 pts) and +102.7 % over 9700X (20,320 pts).
Single‑core: 9950X scores 2,245 pts, +0.7 % over 9950X3D (2,229 pts), +2.0 % over 9700X (2,202 pts) and +9.0 % over 9800X3D (2,059 pts).
Click on the table to enlarge the image.
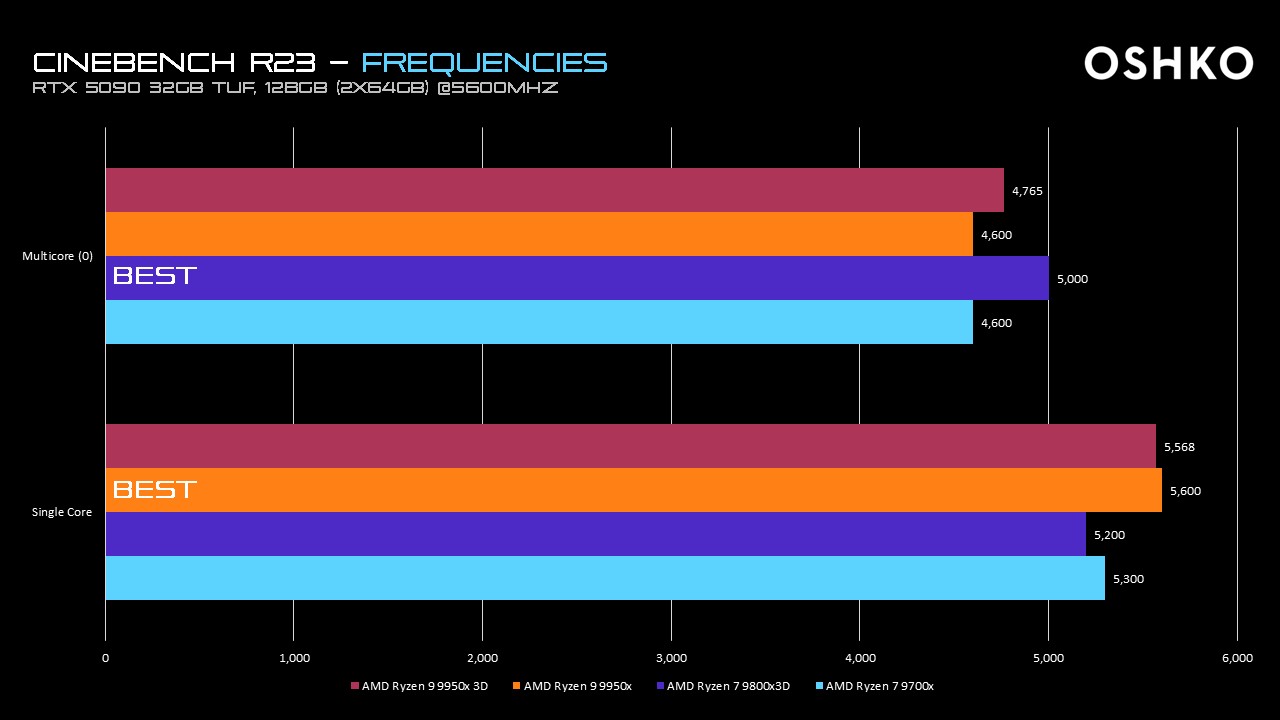
CINEBENCH R23 – FREQUENCIES: 9950X AHEAD IN SINGLE CORE
Multi‑core: 9800X3D peaks at 5,000 MHz, +8.7 % over 9950X and 9700X (both 4,600 MHz). 9950X3D (4,765 MHz) follows with +3.6 % over the 4,600 MHz competitors.
Single‑core: 9950X boosts to 5,600 MHz, +0.6 % over 9950X3D (5,568 MHz), +7.7 % over 9800X3D (5,200 MHz) and +5.7 % over 9700X (5,300 MHz).
Click on the table to enlarge the image.
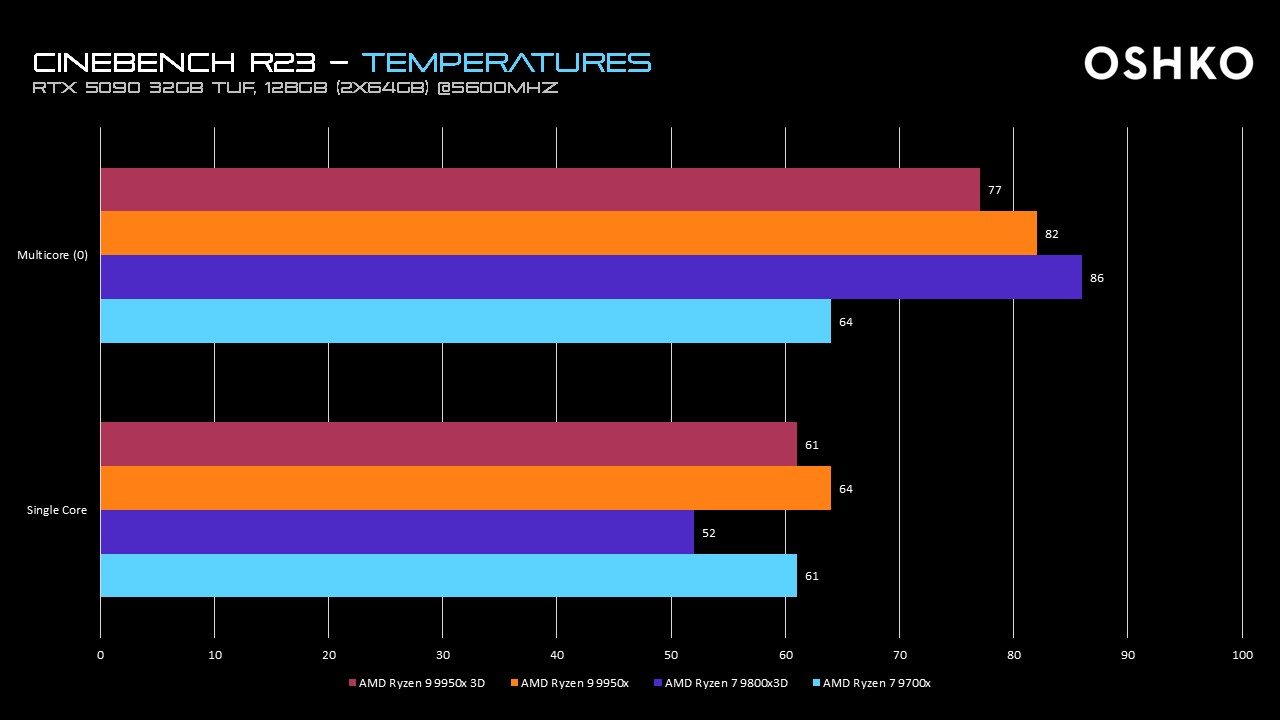
CINEBENCH R23 – TEMPERATURES: 9800X3D RUNS HOT IN MULTI CORE
Multi‑core: 9800X3D peaks at 86 °C, +4.9 % vs 9950X (82 °C), +11.7 % vs 9950X3D (77 °C) and +34.4 % vs 9700X (64 °C).
Single‑core: 9800X3D is coolest at 52 °C, well below the others, notably 9950X (64 °C, +23.1 %).
Click on the table to enlarge the image.
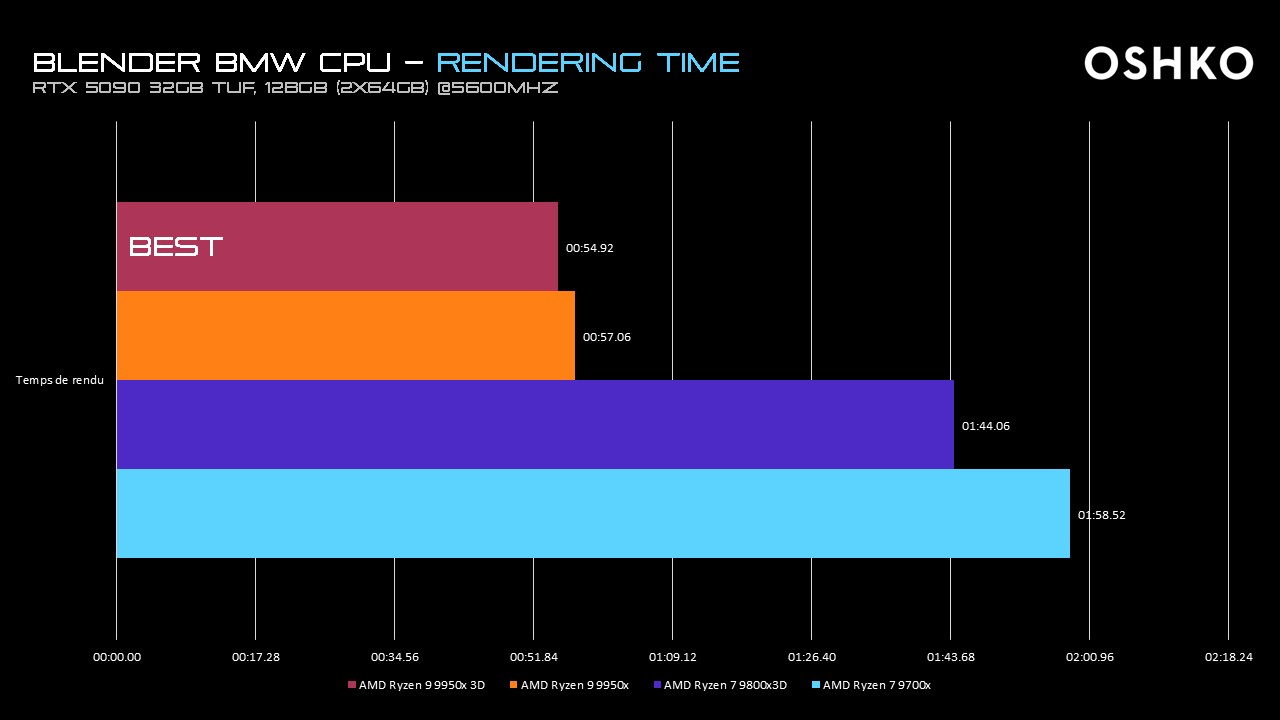
BLENDER – BMW CPU: 9950X3D SHATTERS RENDER TIME
Render time: 9950X3D completes in 54.92 s, -3.8 % versus 9950X (57.06 s). The gap widens against 9800X3D (1:44.06 → 104.06 s, -47.2 %) and 9700X (1:58.52 → 118.52 s, -53.7 %).
Click on the table to enlarge the image.
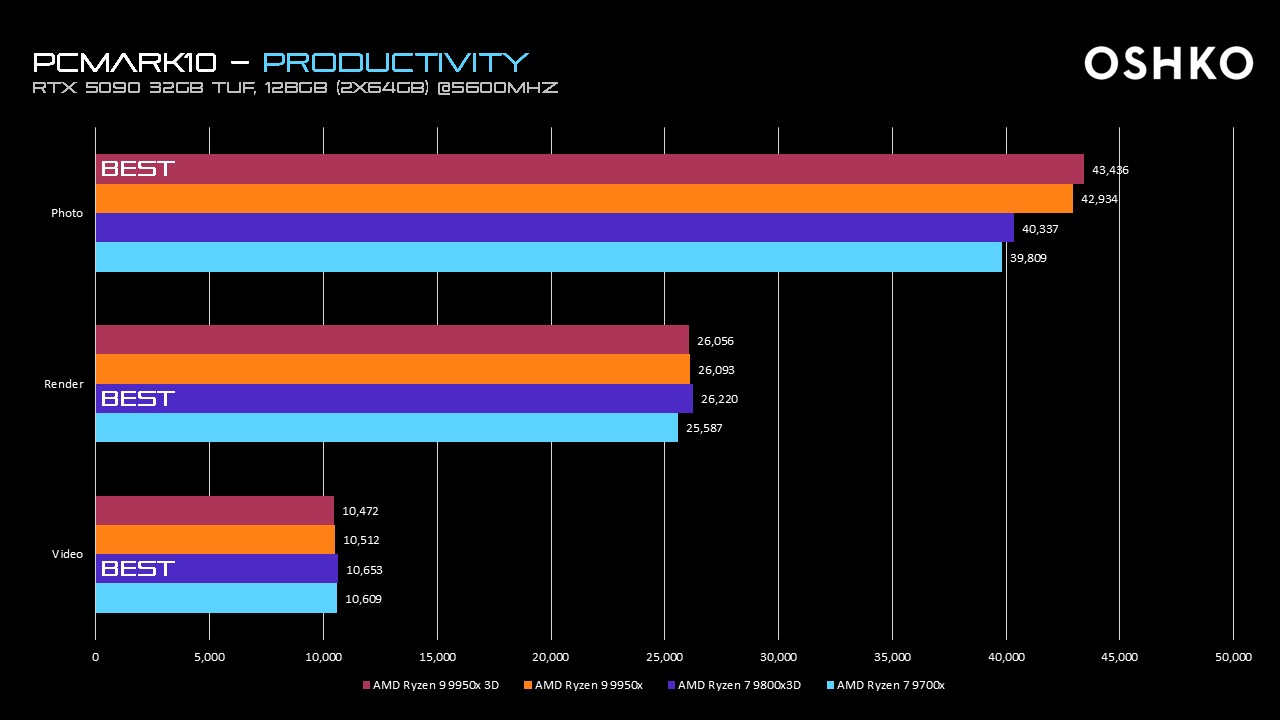
PCMARK 10 – PRODUCTIVITY: NEAR IDENTICAL IN VIDEO AND RENDERING
Photo: 9950X3D scores 43,436 pts, +1.2 % over 9950X (42,934 pts), +7.7 % over 9800X3D (40,337 pts) and +9.1 % over 9700X (39,809 pts).
Rendering: 9800X3D leads with 26,220 pts, +0.6 % over 9950X3D (26,056 pts), +0.5 % over 9950X (26,093 pts) and +2.5 % over 9700X (25,587 pts).
Video: scores are very close, 9800X3D posts 10,653 pts, +1.7 % vs 9950X3D (10,472 pts), +1.3 % vs 9950X (10,512 pts) and +0.4 % vs 9700X (10,609 pts).
Click on the table to enlarge the image.
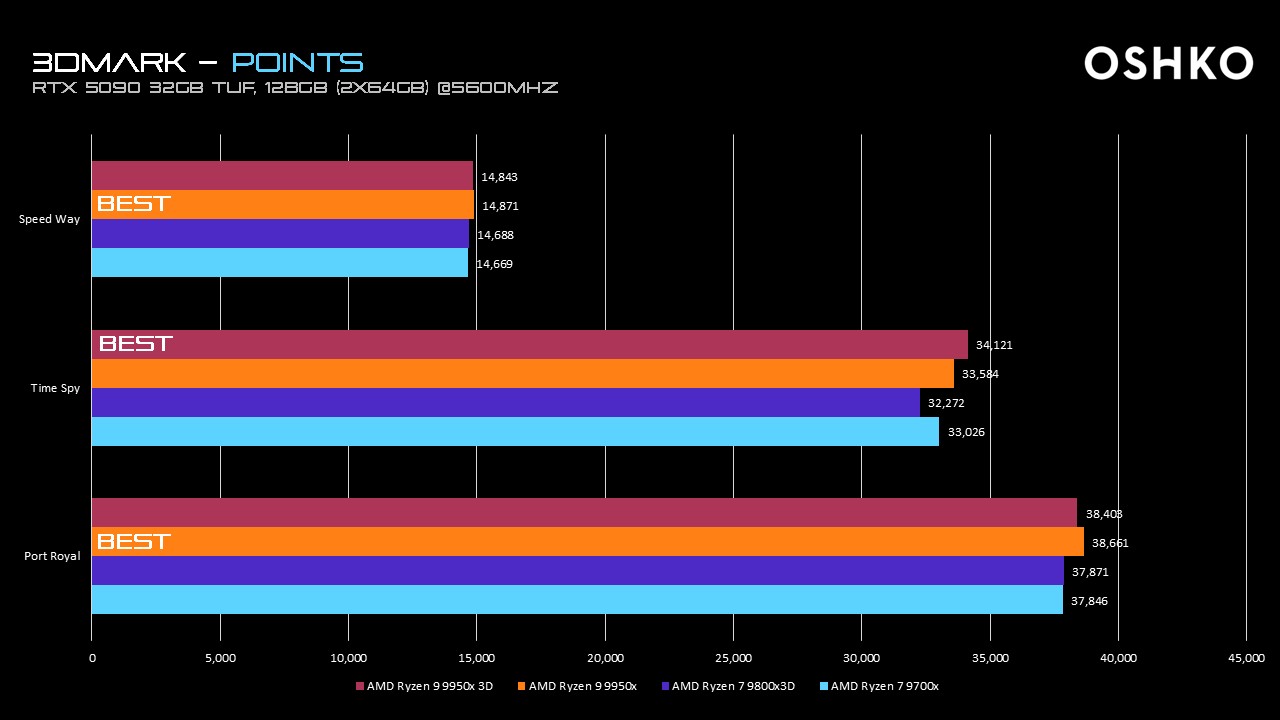
3DMARK – GPU TESTS: MARGINAL GAINS ON ALL TESTS
Speed Way: 9950X hits 14,871 pts, +0.2 % over 9950X3D (14,843 pts), +1.3 % over 9800X3D (14,688 pts) and +1.4 % over 9700X (14,669 pts).
Time Spy: 9950X3D leads with 34,121 pts, +1.6 % vs 9950X (33,584 pts), +3.3 % vs 9700X (33,026 pts) and +5.7 % vs 9800X3D (32,272 pts).
Port Royal: 9950X tops 38,661 pts, +0.7 % vs 9950X3D (38,408 pts), +2.1 % vs 9800X3D (37,871 pts) and +2.2 % vs 9700X (37,846 pts).
Click on the table to enlarge the image.
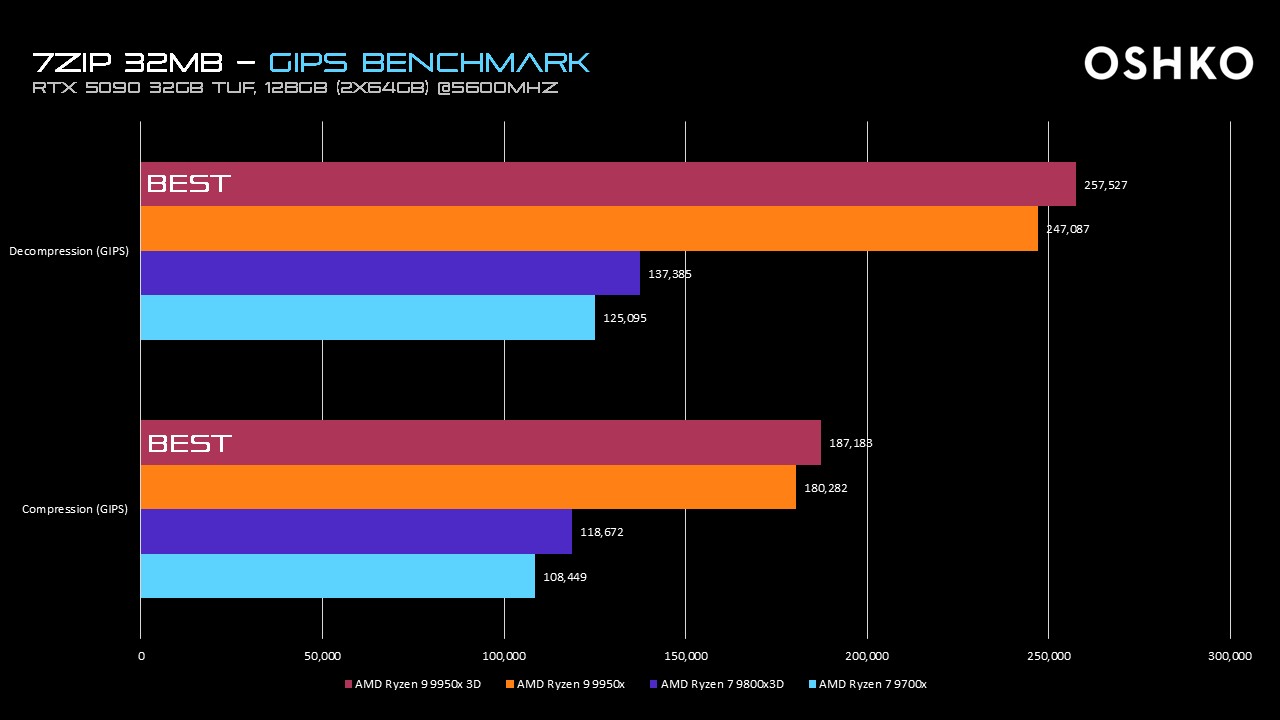
7 ZIP – COMPRESSION & DECOMPRESSION: 9950X3D DOMINATES BOTH
Decompression: 9950X3D reaches 257,527 GIPS, +4.2 % vs 9950X (247,087 GIPS), +87.5 % vs 9800X3D (137,385 GIPS) and +105.9 % vs 9700X (125,095 GIPS).
Compression: 9950X3D scores 187,188 GIPS, +3.8 % vs 9950X (180,282 GIPS), +57.8 % vs 9800X3D (118,672 GIPS) and +72.7 % vs 9700X (108,449 GIPS).
Click on the table to enlarge the image.
CONCLUSION: WHICH CPU FOR YOUR WORKSTATION?
After evaluating the Ryzen 9700X, 9800X3D, 9950X and 9950X3D across productivity focused benchmarks, the verdict is clear: the Ryzen 9 lineup, especially the 9950X3D, stands out in demanding tasks such as 3D rendering and file compression. If your workflow regularly involves these intensive applications, investing in a Ryzen 9, particularly the 9950X3D, is fully justified by its significant performance gains.
For more varied workloads or GPU bound scenarios, differences narrow considerably. The Ryzen 7 9700X offers very attractive pricing, while the 9800X3D strikes a good balance thanks to its large L3 cache that shines in certain specific contexts.
In short, the optimal choice depends directly on your professional use case: for maximum performance and heavy regular loads, choose a Ryzen 9, ideally the 3D variant, without hesitation. For less intensive yet still solid performance, the Ryzen 7 chips remain very appealing alternatives, offering excellent value for money.
If you have a benchmark you’d like us to run or a performance topic you’d like us to explore, reach out to our team at OSHKO, we’re always eager to put the numbers to the test and deliver insights that matter to you.